
Blog
Managing Tool Wear in Tight-Tolerance Metal Fabrication: A Data-Driven Evaluation of Consumable Economics and Process Stability
2026年10月30日
Why Tool Wear Quietly Destroys Tight-Tolerance Profitability
In tight-tolerance metal fabrication, a worn tool rarely announces itself with a catastrophic failure. Instead, it degrades quietly — dimensional drift of 5–15 µm, burr height creeping from 20 µm to 80 µm, and surface finish sliding from Ra 0.4 to Ra 1.2. For a shop holding ±0.0005″ (±12.7 µm) on a production run, that silent drift is the difference between a passed first article and a rejected lot of 4,000 parts. The B2B economics are unforgiving: scrap, rework, expedited tooling orders, and unplanned spindle downtime typically consume 8–15% of operating margin in high-mix fabrication environments.
This technical evaluation treats tool wear as an engineering variable to be measured, modeled, and monetized — not as an unavoidable cost of doing business. We examine wear mechanisms, quantification methods against relevant standards, and the total cost of ownership (TCO) math that should govern every procurement decision.
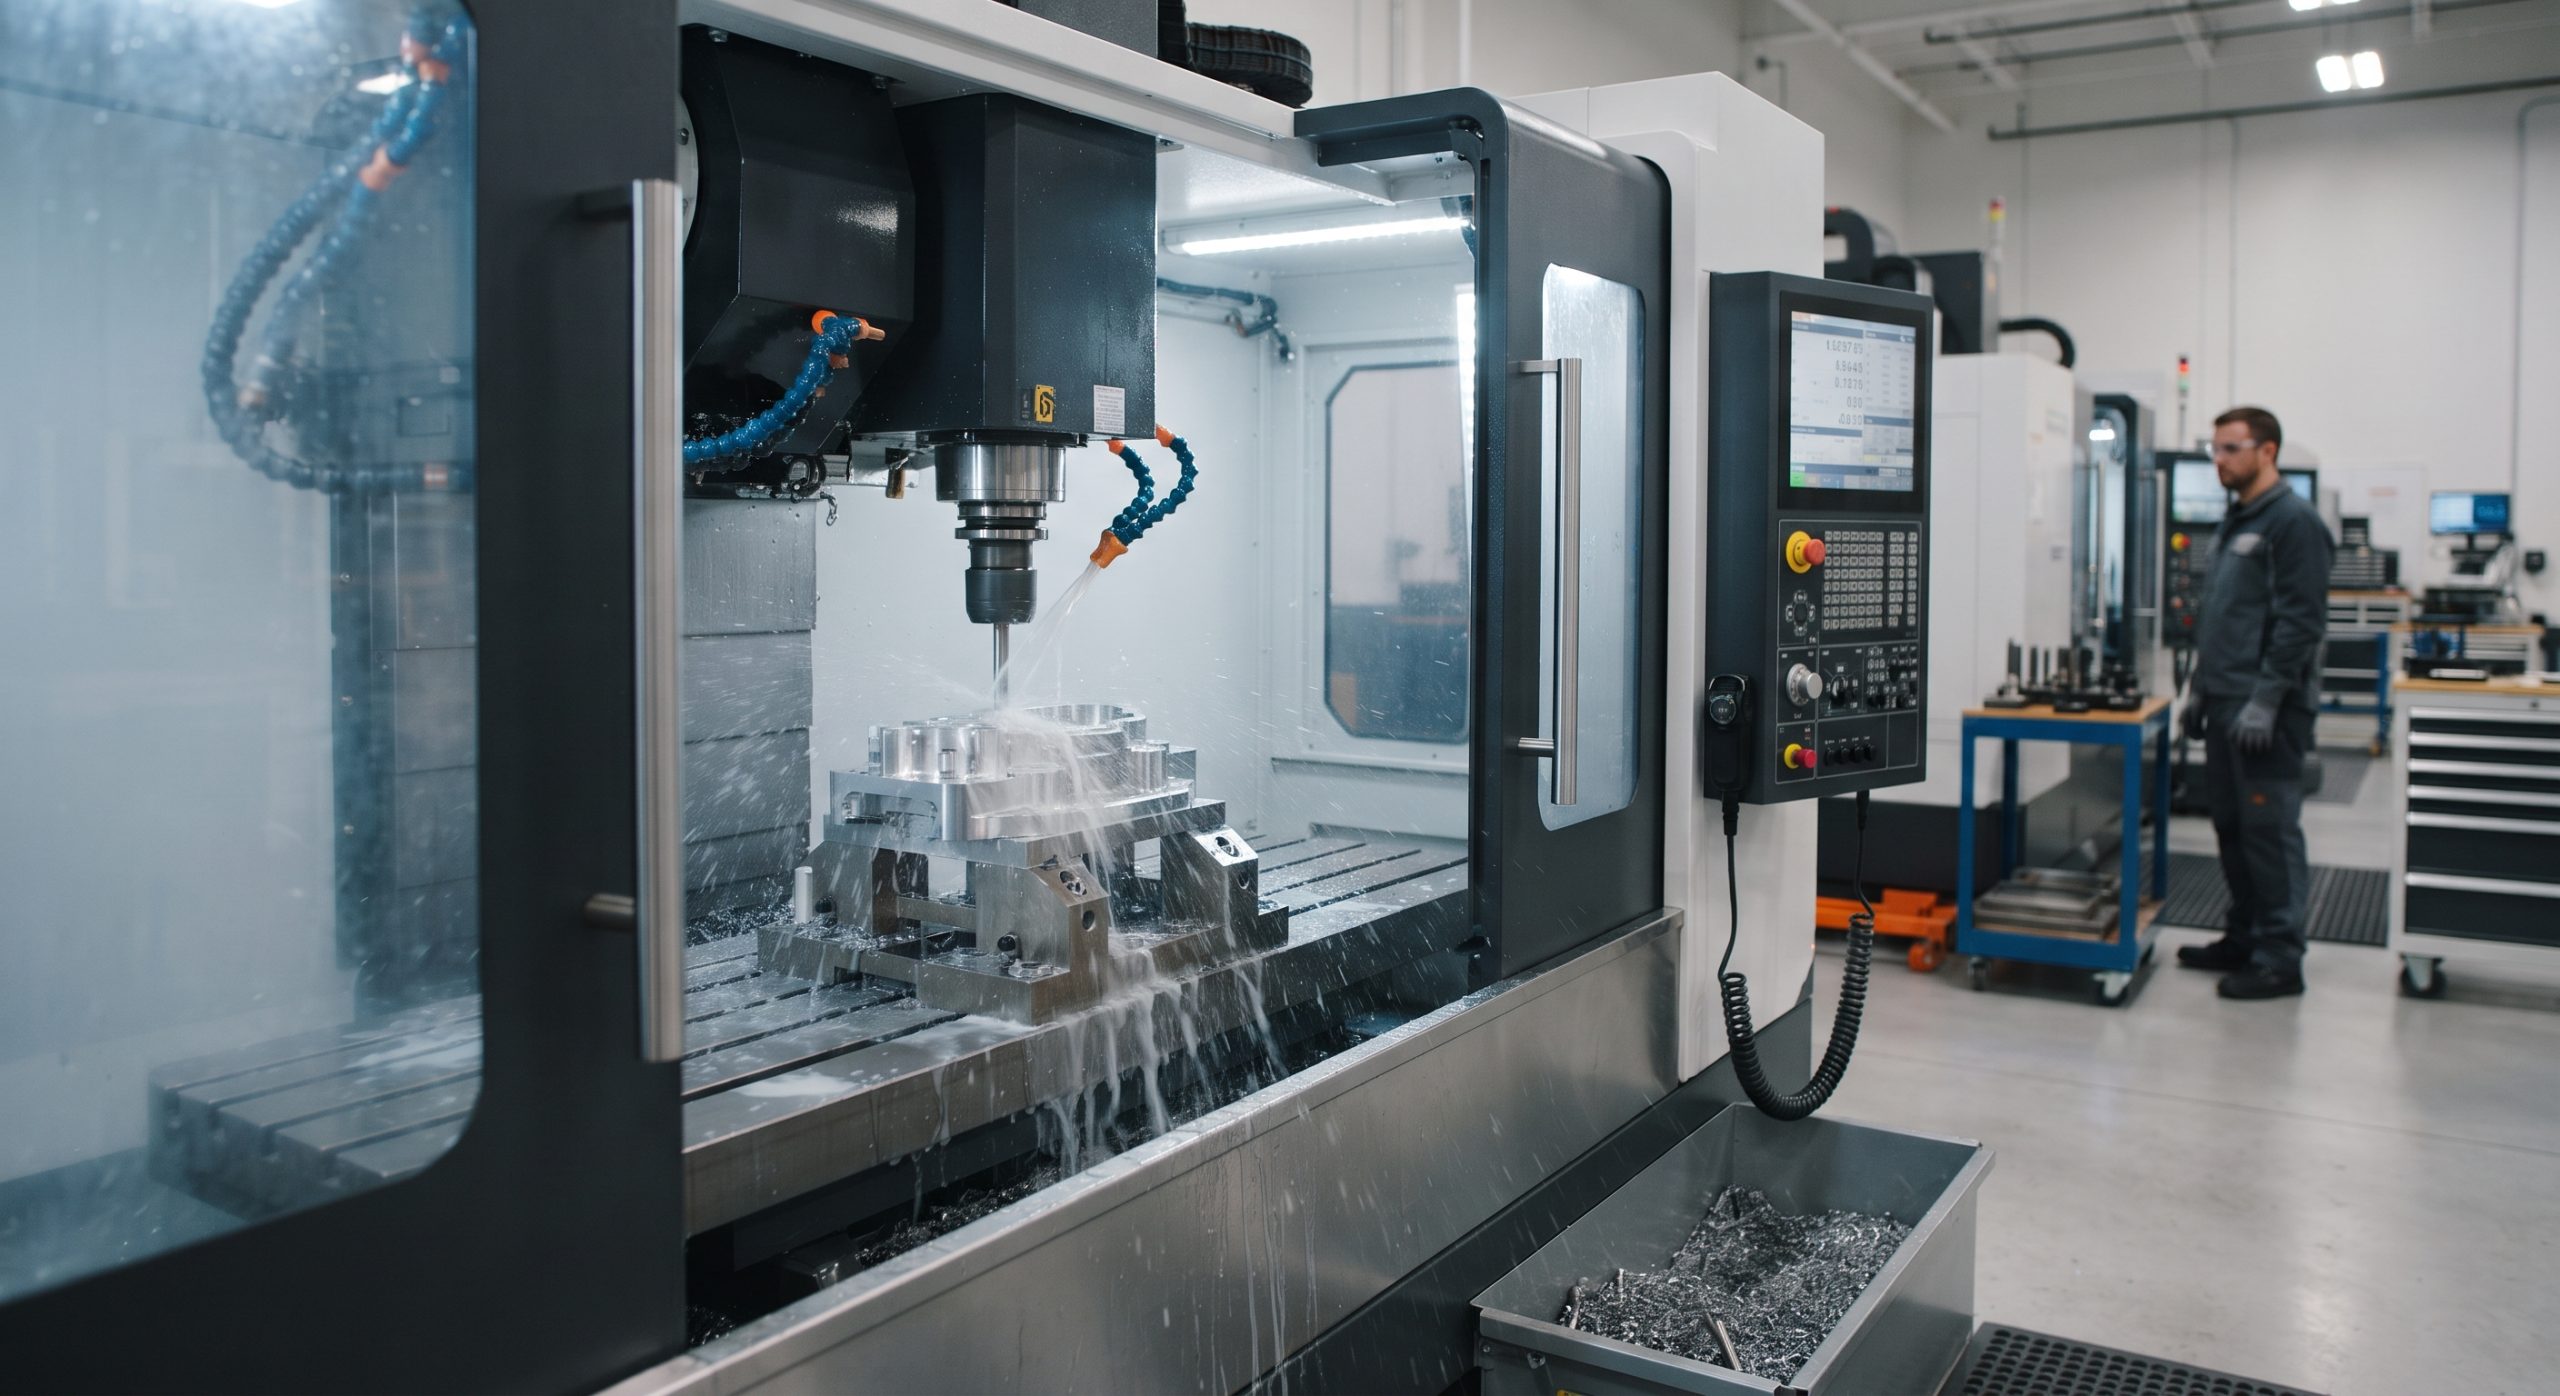
The Physics of Wear: Mechanisms That Drive Dimensional Drift
Abrasive and Adhesive Wear in Carbide and CBN Tooling
In machining of hardened steels (HRC 45–62), stainless alloys, and superalloys, three wear modes dominate. Abrasive wear removes binder cobalt from tungsten carbide, exposing carbide grains that fracture and pull out — flank wear (VB) grows predictably with cutting length. Adhesive wear (built-up edge) accelerates in gummy materials like 316L stainless and aluminum, causing edge chipping. Diffusion and chemical wear become significant above 900°C at the cutting interface, particularly with titanium alloys.
Crater, Notch, and Thermal Cracking
Crater wear on the rake face follows a temperature-dependent parabolic curve peaking at 15–25 m/min for HSS and 120–180 m/min for carbide in steel. Notch wear concentrates at the depth-of-cut line, exacerbated by work-hardened surfaces. Thermal fatigue cracking appears in interrupted cuts where cyclic heating exceeds 200°C per cycle — a leading cause of sudden edge failure in gear hobbing and broaching.
Quantifying Tool Life: The Extended Taylor Equation
The classical Taylor tool life equation (VTⁿ = C) is insufficient for modern tight-tolerance fabrication. The extended form VTⁿfᵃdᵇ = C incorporates feed (f) and depth of cut (d), enabling shops to model expected flank wear against production volume. A carbide insert cutting 4140 steel at 180 m/min with n = 0.25 will yield roughly 4× tool life when speed is reduced 30% — a trade-off that must be weighed against throughput.
Wear Quantification: Standards, Metrics, and Measurement Cadence
Objective wear tracking requires documented methods. Flank wear (VB) is measured per ISO 8688 (milling) and ISO 3685 (single-point turning), with the standard end-of-life criterion at VB = 0.3 mm for finishing operations and 0.6 mm for roughing. For tight-tolerance work, however, dimensional drift typically hits the tolerance limit before VB reaches 0.3 mm — shops should establish an internal wear limit of 0.15–0.2 mm for finishing tools.
Recommended measurement cadence: tool presetter inspection every 50–100 parts for high-value finishing tools, in-machine probing every 25 parts on critical features, and acoustic emission monitoring for unattended lights-out operations. ISO 9001:2015 and AS9100D (aerospace) require documented tool life management procedures; IATF 16949 adds statistical process control requirements for automotive production.
Critical Output Metrics
The following parameters must be tracked in any disciplined tool wear management program:
| Key Parameter | Technical Specification |
|---|---|
| Wear Measurement Standard | ISO 3685 (turning) / ISO 8688 (milling) |
| Flank Wear Limit (Finish) | VB = 0.15–0.2 mm (internal tighter than 0.3 mm standard) |
| Coatings | PVD TiAlN, AlCrN, DLC, CBN for hard turning |
| Coolant Pressure | HPC 70–150 bar through-spindle |
| Thermal Compensation | Spindle/ball-screw cooling + software real-time compensation |
| Quality System Standards | ISO 9001:2015, AS9100D, IATF 16949 |
Wear Mitigation Strategy: Coatings, Cooling, and Process Control
Coatings That Extend Tool Life 3–10×
PVD TiAlN coatings raise the oxidation threshold to 800°C, delivering 3–5× tool life in steel milling. AlCrN pushes this to 1,100°C and excels in dry machining and high-temperature alloys. Diamond-like carbon (DLC) coatings reduce friction coefficient to 0.1 in aluminum and copper. For hard turning (HRC 58–62), CBN inserts with ceramic coatings are now standard, achieving 0.2–0.4 µm surface finish without grinding — provided the machine has sufficient rigidity (typically 15+ kW spindle and thermal compensation).
Cooling and Thermal Stability
Coolant strategy directly affects wear rate. High-pressure coolant (HPC) at 70–150 bar through-spindle delivers coolant to the cutting edge, reducing crater wear by 40–60% in difficult-to-machine alloys. Minimum quantity lubrication (MQL) is effective for aluminum but generally inadequate for stainless above 150 m/min. Cryogenic machining with liquid nitrogen (LN₂) is increasingly adopted in titanium and Inconel production, though it requires dedicated tooling and machine modifications.
Thermal Compensation for Tight Tolerances
In tight-tolerance fabrication, machine thermal drift can exceed tool wear as the dominant error source. Spindle growth of 10–30 µm over an 8-hour shift is common on machines without compensation. Thermal compensation systems (ball-screw cooling, spindle oil chillers, and software-based compensation using real-time sensor data) reduce this error by 70–90% and are effectively mandatory for holding ±5 µm tolerances.

Consumable Economics and Total Cost of Ownership
The TCO of tooling should be calculated per acceptable part produced, not per tool purchased. A tool that costs $85 but produces 400 parts with 2% scrap is generally more economical than a $40 tool producing 250 parts with 5% scrap — even before accounting for the labor and machine time required to replace it.
- Consumable cost per part: (Tool cost / Parts per tool) + (Scrap rate × Part material + labor cost)
- Downtime cost: Tool changes of 2–4 minutes on a $150/hour machine cost $5–10 per change — often exceeding the tool cost itself
- Quality escape cost: A single rejected lot in a regulated industry (medical device, aerospace) can exceed $50,000 in containment, re-inspection, and customer penalties
Regrinding and recoating services can recover 60–75% of tool life at 30–40% of new tool cost. For carbide end mills above 12 mm diameter, this is almost always economically justified. For small drills and inserts, replacement is typically more economical.
Conclusions and Strategic Recommendations
Tool wear management in tight-tolerance metal fabrication is a systems problem, not a procurement line item. The shops that consistently hold ±10 µm tolerances do three things: they model expected tool life using extended Taylor relationships, they monitor wear against ISO 3685/8688 criteria with documented measurement cadence, and they calculate consumable cost per acceptable part rather than per unit purchased. The B2B manufacturers that treat tooling as an engineering variable — with the same rigor applied to spindle thermal compensation or CMM calibration — consistently achieve 10–20% lower total cost per part than competitors who view tooling as a commodity expense.